Updated COVID-19 Vaccination Rates for Monroe County and City of Rochester Census Tracts
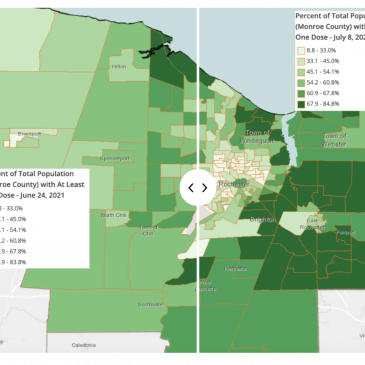
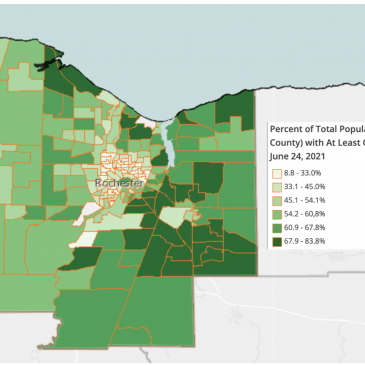
Recently available data for the City of Rochester and for Monroe County show that 71 County census tracts have vaccination rates of 60% or above.
The continuing effort to provide vaccines closer to where people live is helping increase the rates in many Monroe County census tracts. These county-level data, now available bi-weekly, will continue to inform targeted vaccination locations to ensure access by communities with the highest need.
These vaccination data are made available through the collaborative efforts of the Finger Lakes Vaccine Hub, the Finger Lakes Hub Task Force, the Rochester RHIO, the University of Rochester Medical Center, Common Ground Health, and the RocHealthData team.
While the number of kittens admitted over the years is sobering, spay/neuter programs, like those at Lollypop Farm, have a dramatic impact to decrease the number of kitten and cat admissions.
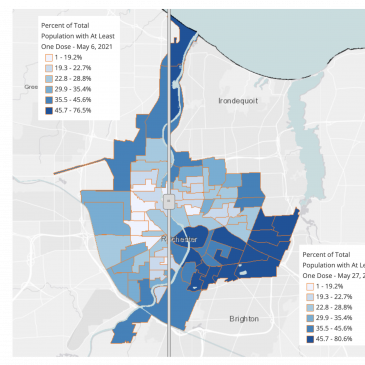
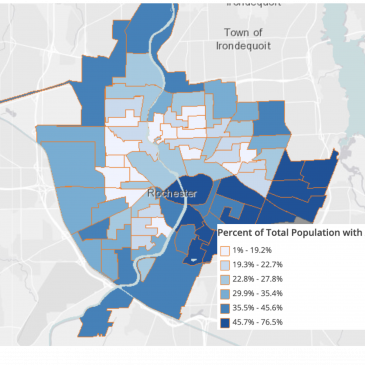
Recent data from the New York State Immunization Information System (NYSIIS) show increases over the past month in COVID-19 vaccination rates within many Rochester census tracts.
Vaccination rates by census tract for the City of Rochester are now available at RocHealthData.
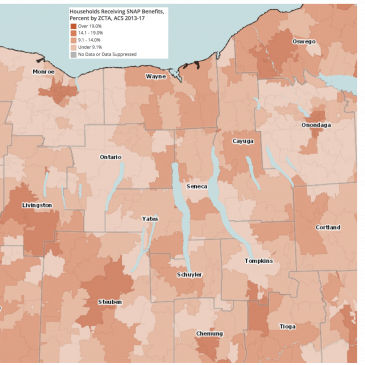
While September may be a time of plenty for some, there are many in our communities who rely on SNAP (Supplemental Nutrition Assistance Program) to provide their families with fresh produce, grains and dairy products. SNAP recipients comprise a large percentage of families across our region: almost half the households in some City of Rochester zip codes receive SNAP benefits.
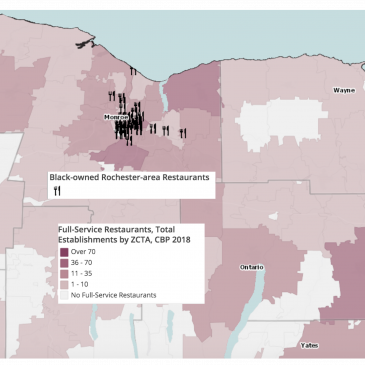
While almost 100,000 Black-owned businesses nationally are in the food industry, only a small percentage of local restaurants are Black-owned. Find and support these local businesses using the maps available in the Map Room, which also shows the numbers of full-service restaurants by zip code.
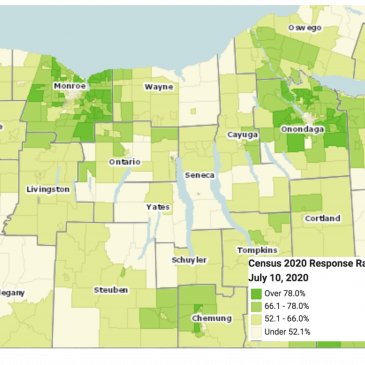
A new tool available at RocHealthData allows mapping of tract-level participation rates from the current census, either for our local region or for any location in the U.S. Data as of July 10th show many rural and urban tracts in our area have comparatively low participation rates.
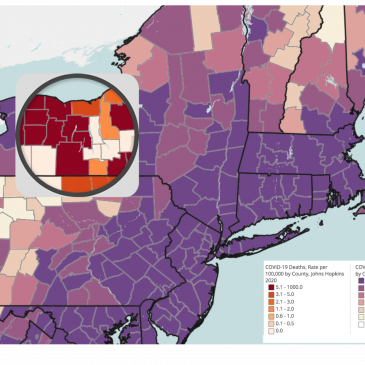
County-level COVID-19 data, including both case and death rates per 100,000 population, are now available at RocHealthData. These data show the variability across our region and across the U.S.