City Health Dashboard was recently named the 2023 National League of Cities’ Capstone Challenge Winner for partnering with Rochester, NY (and two additional cities) to explore the long-term impacts of discriminatory housing practices on health.
In Rochester, the Office of the Chief of Staff for the Mayor worked with City Health Dashboard on maps to visualize whether food access in the city supports nutritious eating and positive health outcomes. First, City Health Dashboard mapped historically redlined neighborhoods. Next, they compared this area to current poverty rates and access to food retail outlets. The maps produced for this analysis can be found at the 2023 Capstone Challenge Report.
What they found was not surprising. Neighborhoods in the city of Rochester that have been historically disadvantaged due to discriminatory practices, such as redlining, continue to have the highest rates of poverty today. In addition, these are the areas that have the lowest rates of access to healthy food retail outlets.
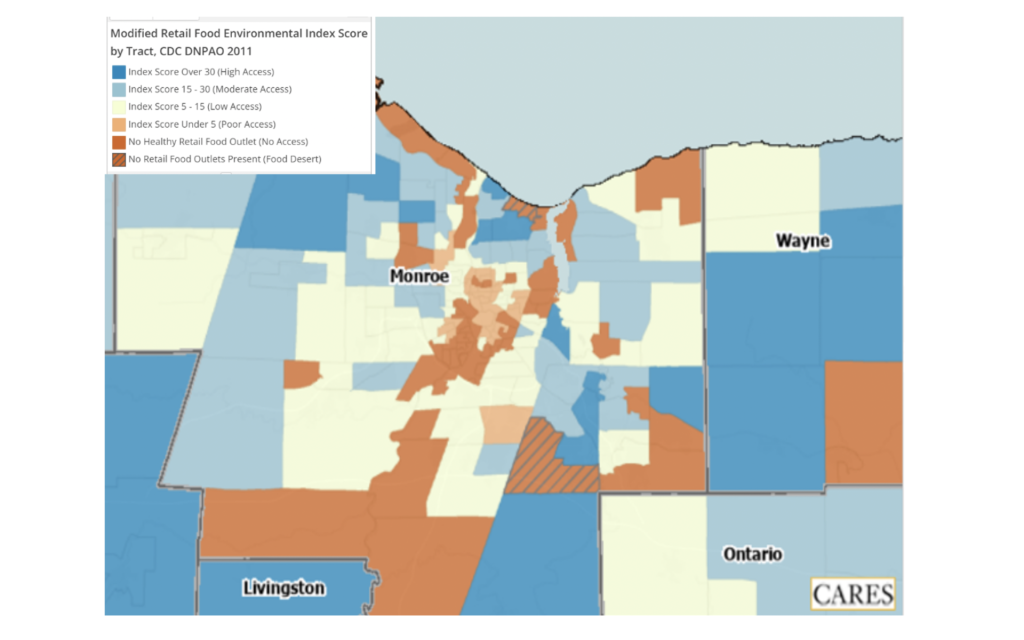
Visit RocHealthData to interact with a similar set of data in our map room.
RocHealthData Team
RocHealthData had no part in this work nor the award. We at RocHealthData congratulate the City of Rochester and City Health Dashboard on their achievement!
The set of data shown is our own, and shows a similar set of data for the upstate region.