RocHealthData is pleased to share data on several key health measures (hypertension, diabetes, and obesity) for the 13-county Finger Lakes region. These data are made available from the Rochester Regional Health Information Organization (RHIO), with collaboration and support from Common Ground Health.
Detailed percentage data (for 2019, 2020, and 2021) by age and by sex for each county are available for download. Included in the downloads for 2020 and 2021 are data by race and by ethnicity for the overall region and for Monroe County.
This information is summarized from more than one million de-identified clinical records from across the region, securely stored by the Rochester RHIO.
Download the Data
Data are freely available for download to our registered users.
If not already a member, you may register here: RocHealthData.org
Data from the Region for 2021
Adults with Hypertension Under Control
Adults with Diabetes Under Control
Adult Obesity Rate
Childhood Obesity Rate
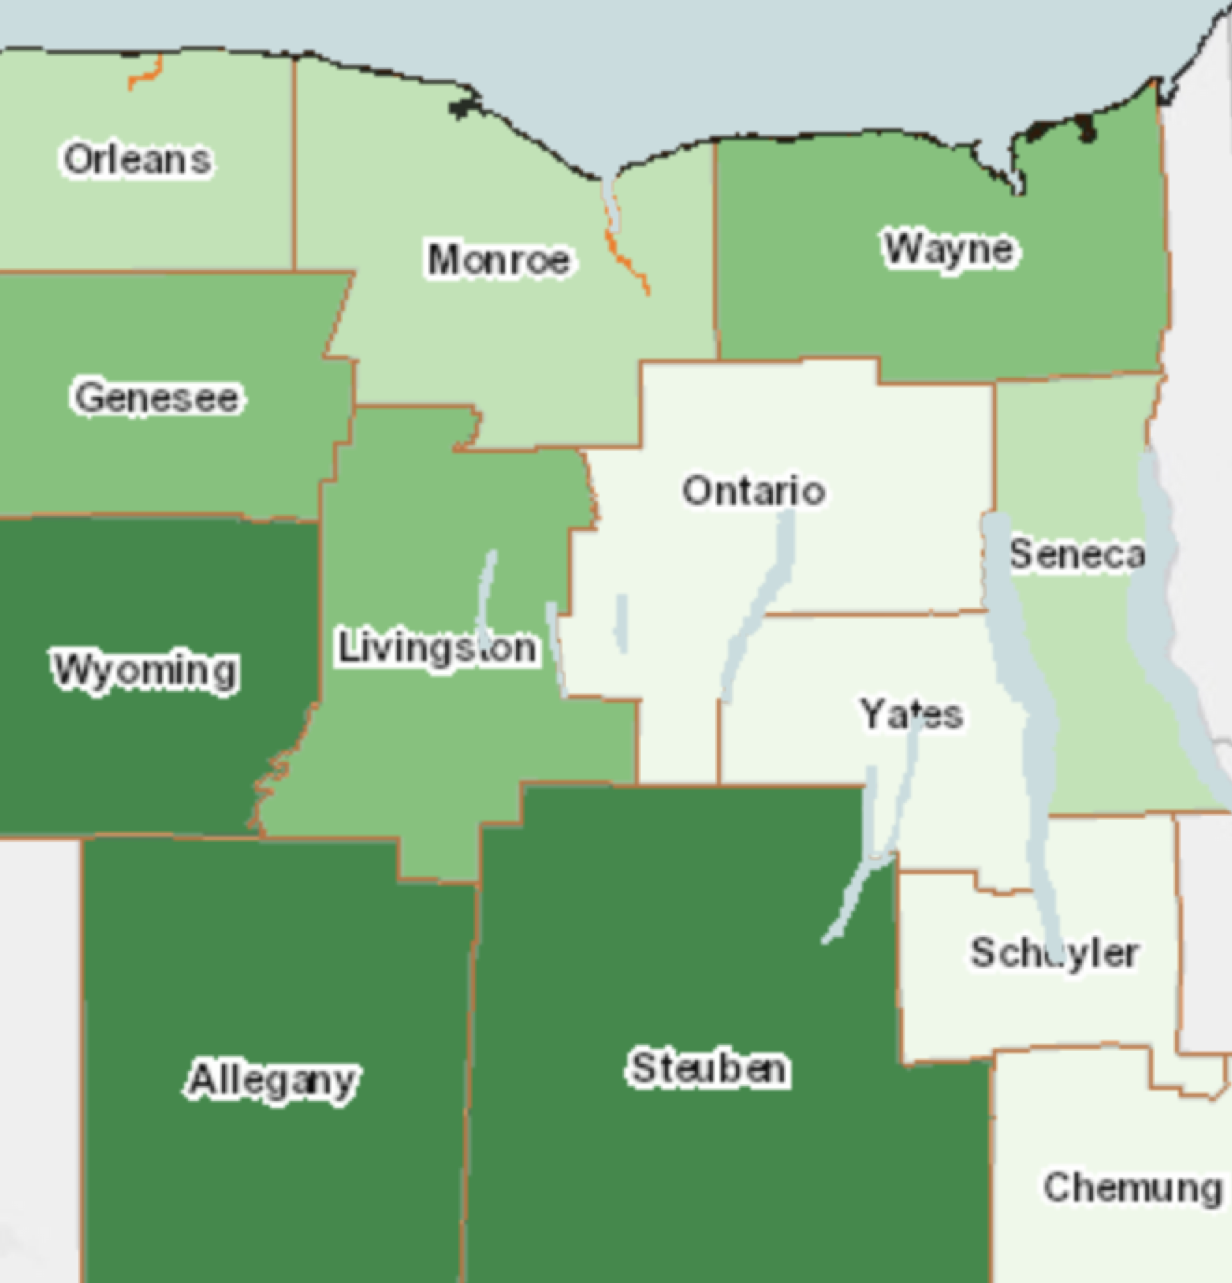
Hypertension Control by County
Hypertension in Control (BP <140/90), Age 18+, % by County – RHIO 2021
64%
Of adults in the region have hypertension in control
(blood pressure < 140/90)
→ 0% change from 2020
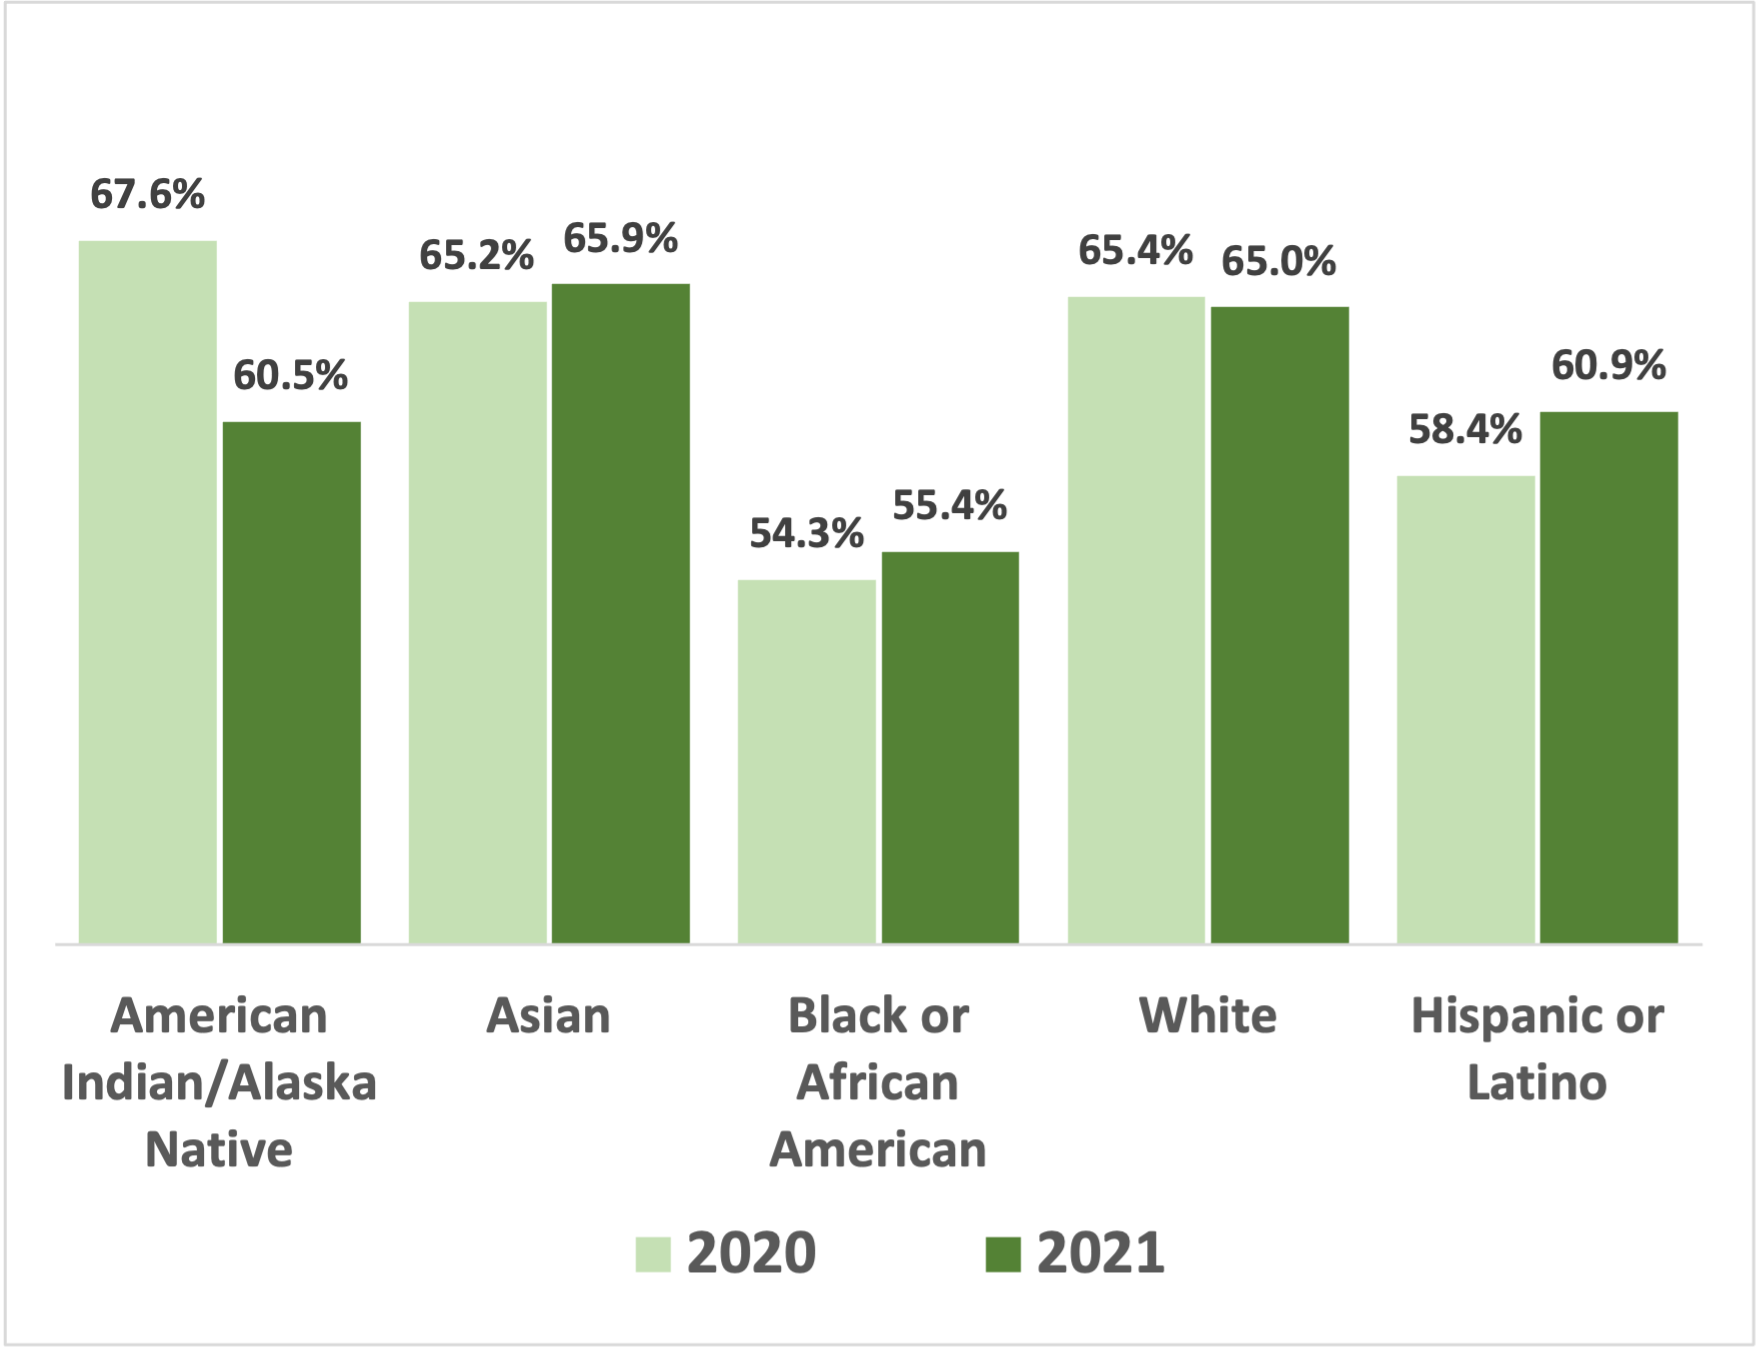
Data shown are for entire region. Race and ethnicity are distinct, not combined. Click to access detailed data by race and ethnicity for Monroe County, as well as details by age and sex for all counties.
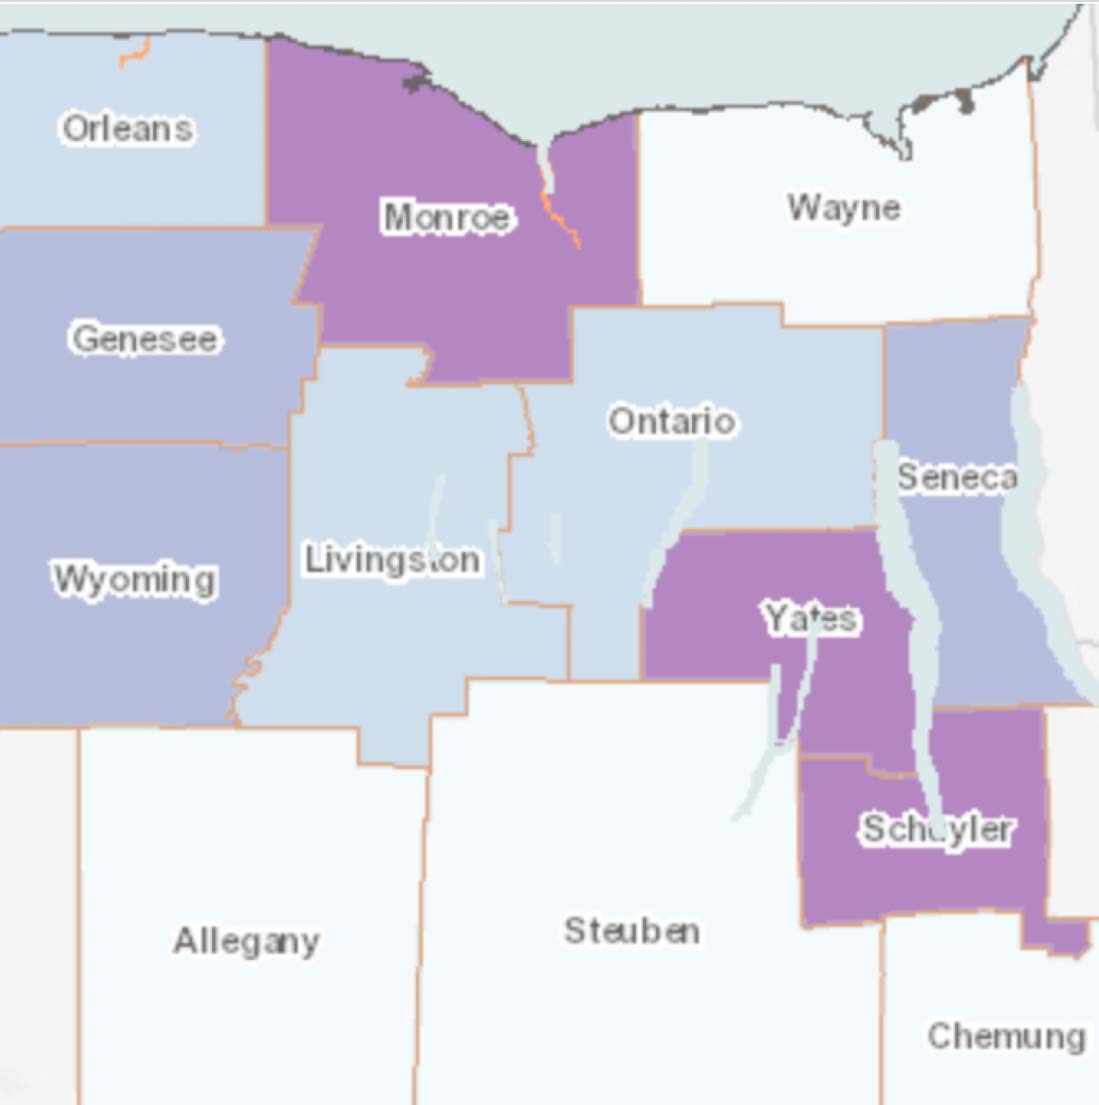
Diabetes Control by County
Diabetes in Control (HbA1c <8%), Age 18+, % by County – RHIO 2021
87%
Of adults in the region have diabetes in control
(HbA1c < 8%)
↑ 4% change from 2020
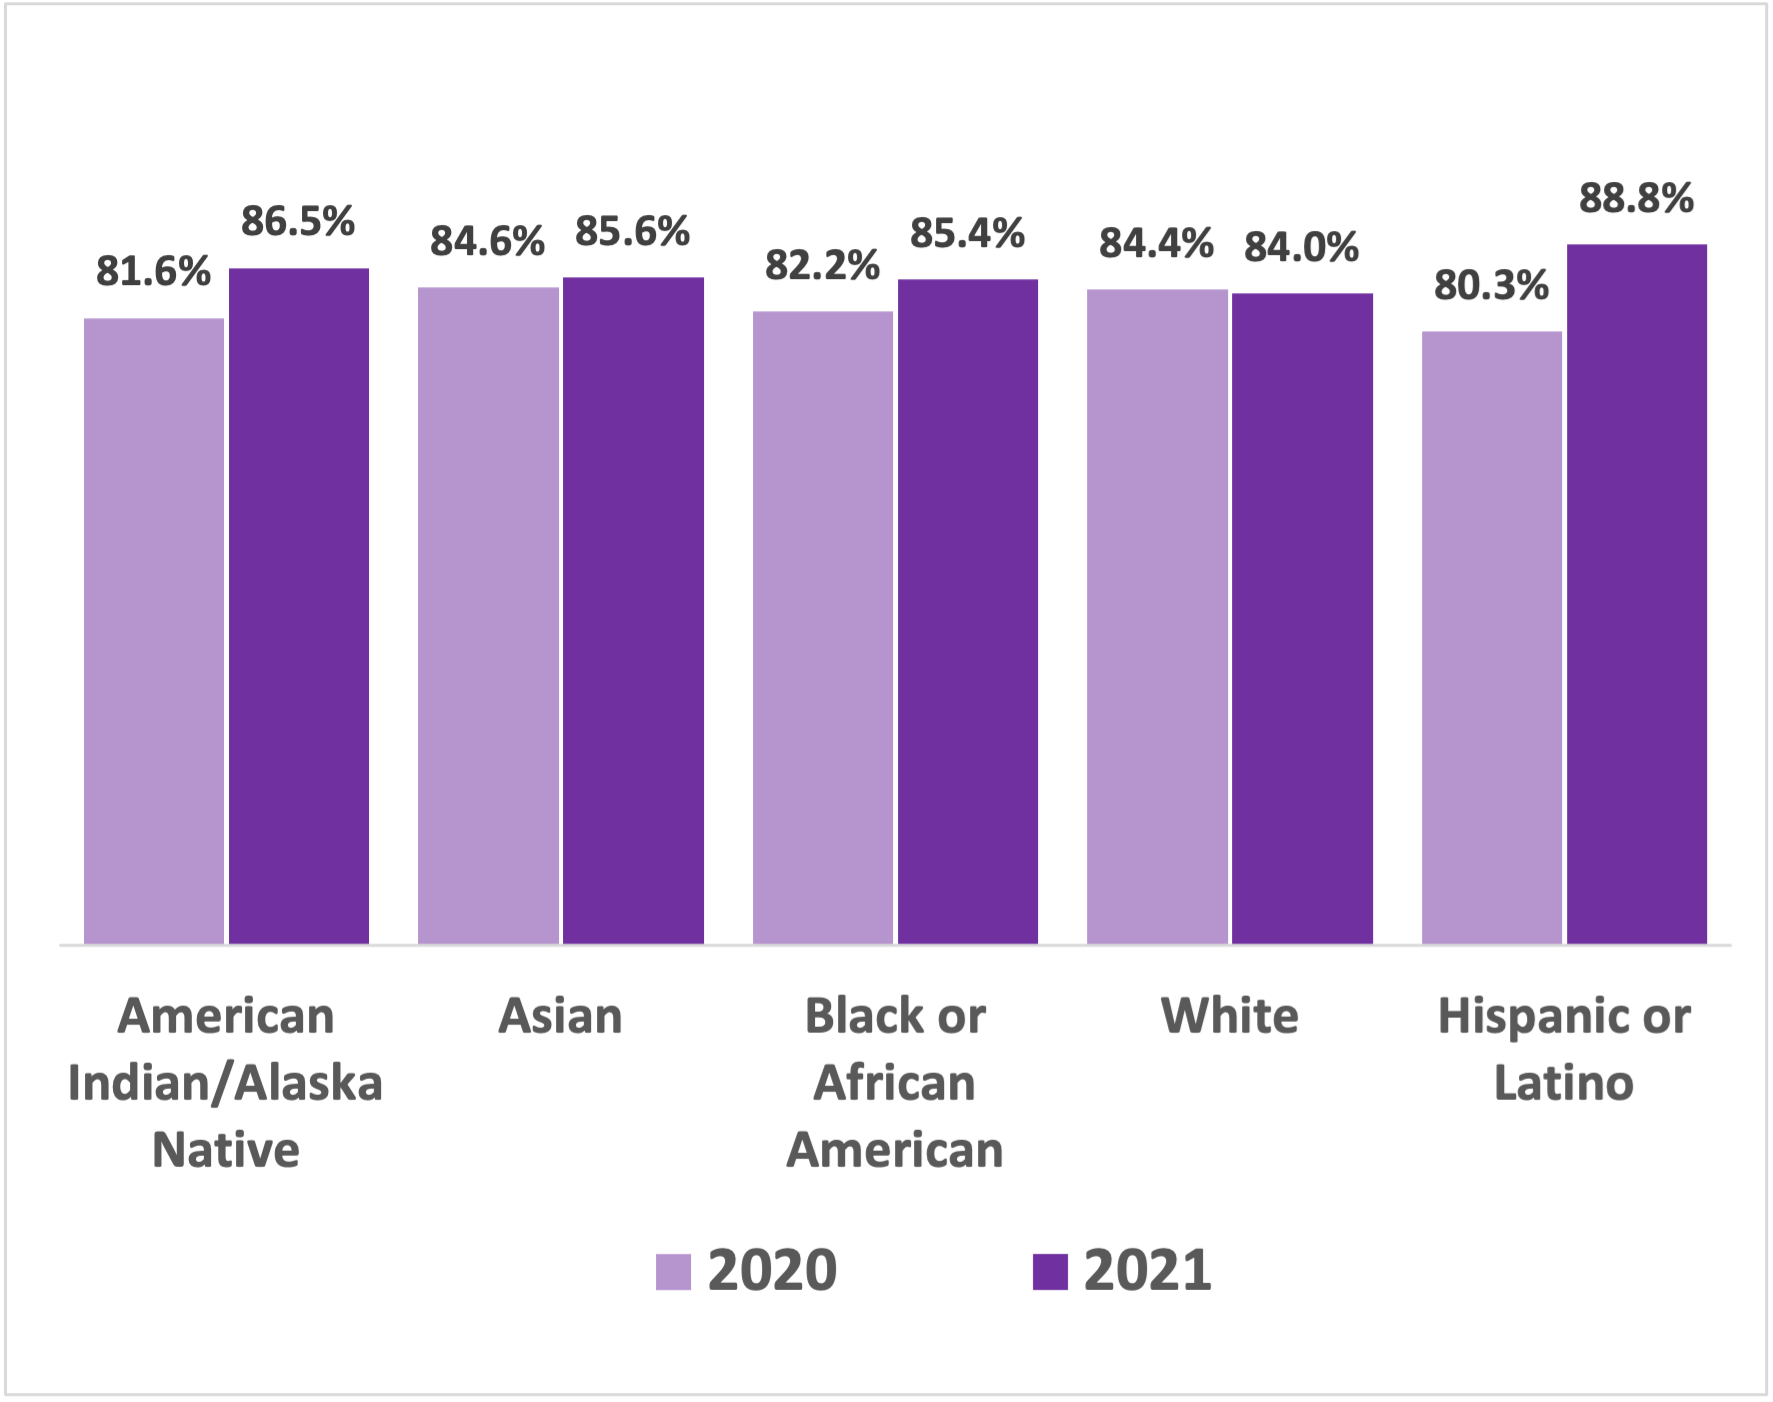
Data shown are for entire region. Race and ethnicity are distinct, not combined. Click to access detailed data by race and ethnicity for Monroe County, as well as details by age and sex for all counties.
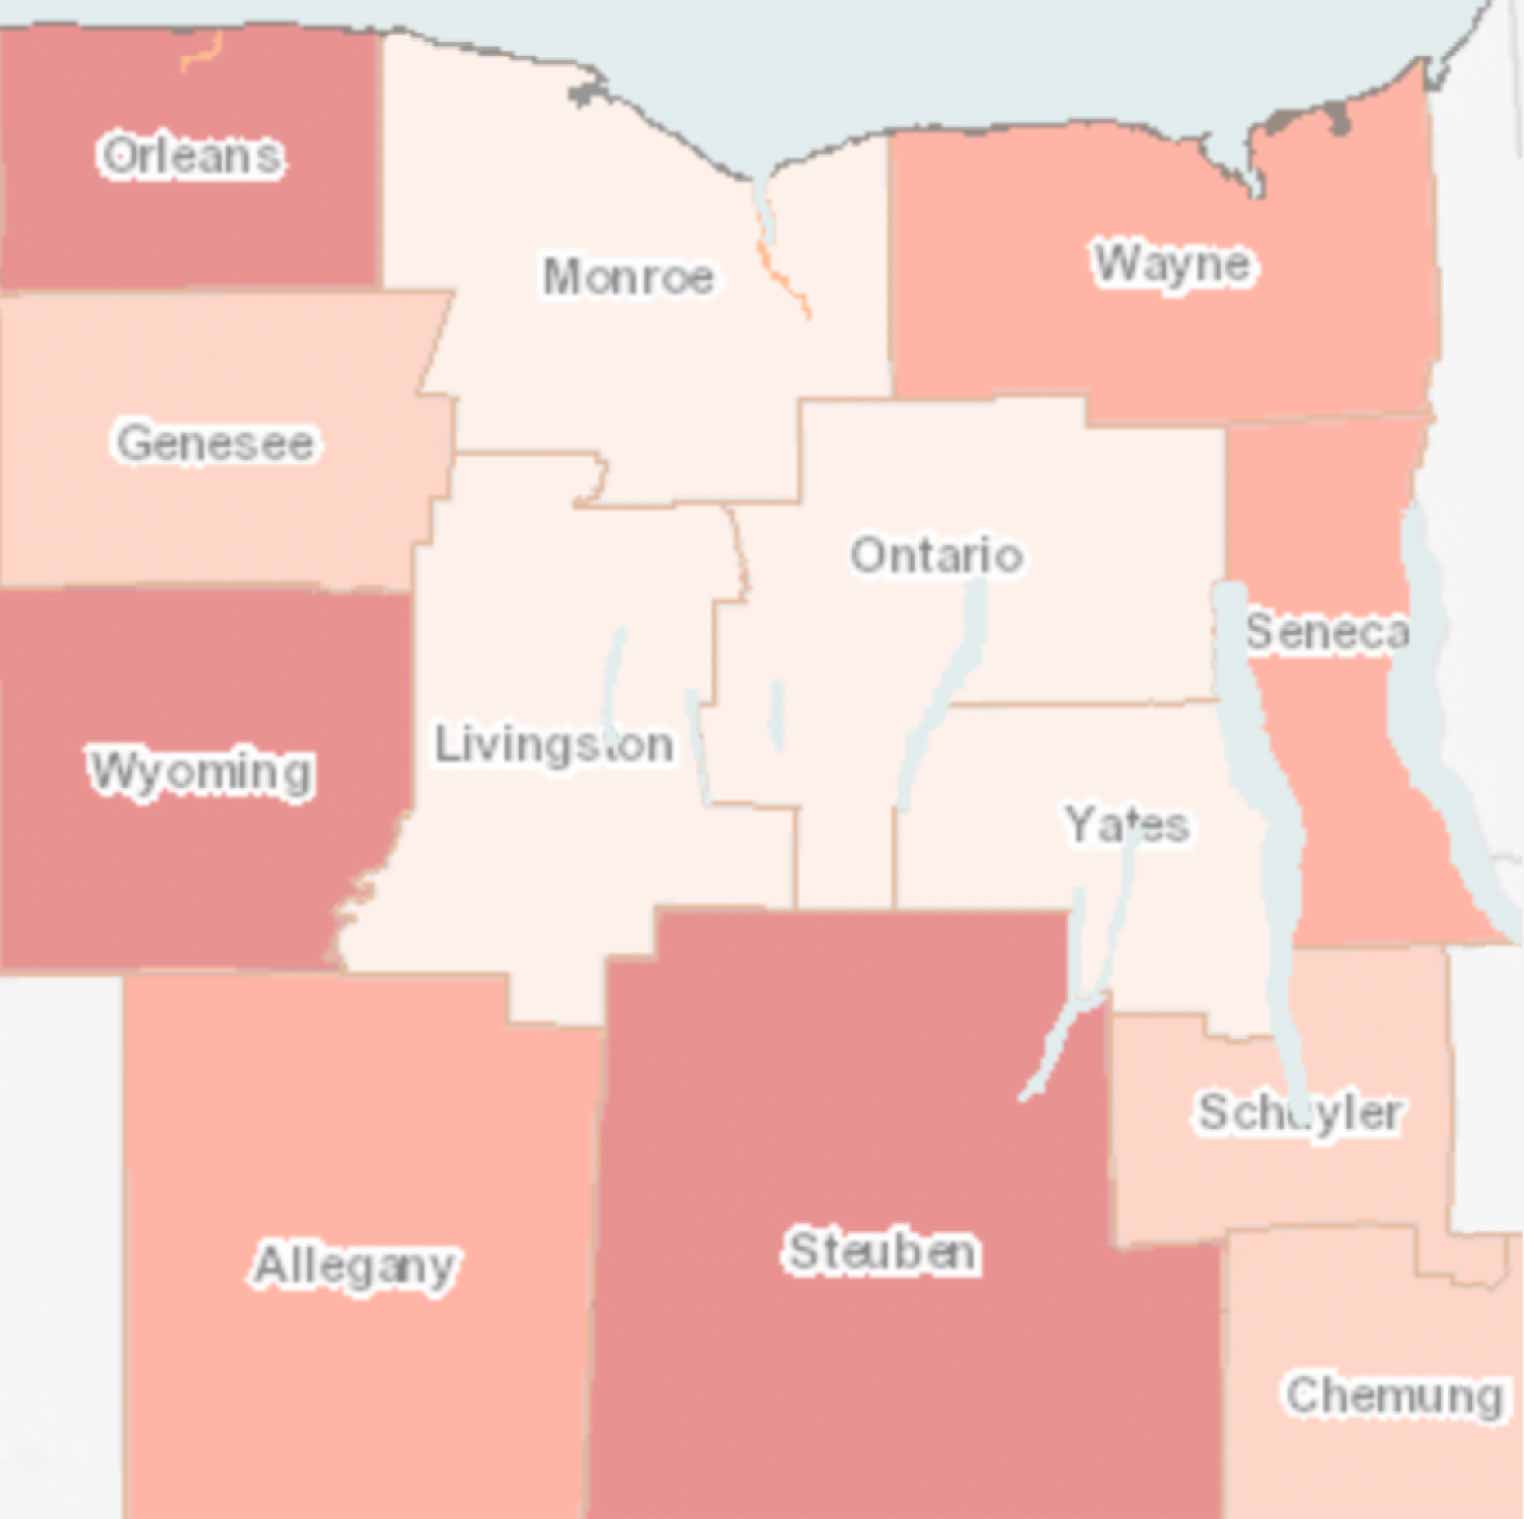
Adult Obesity by County
Obesity (BMI >=30), Age 18+, % by County – RHIO 2021
43%
Of adults in the region are obese
(BMI > 30)
→ 0% change from 2020
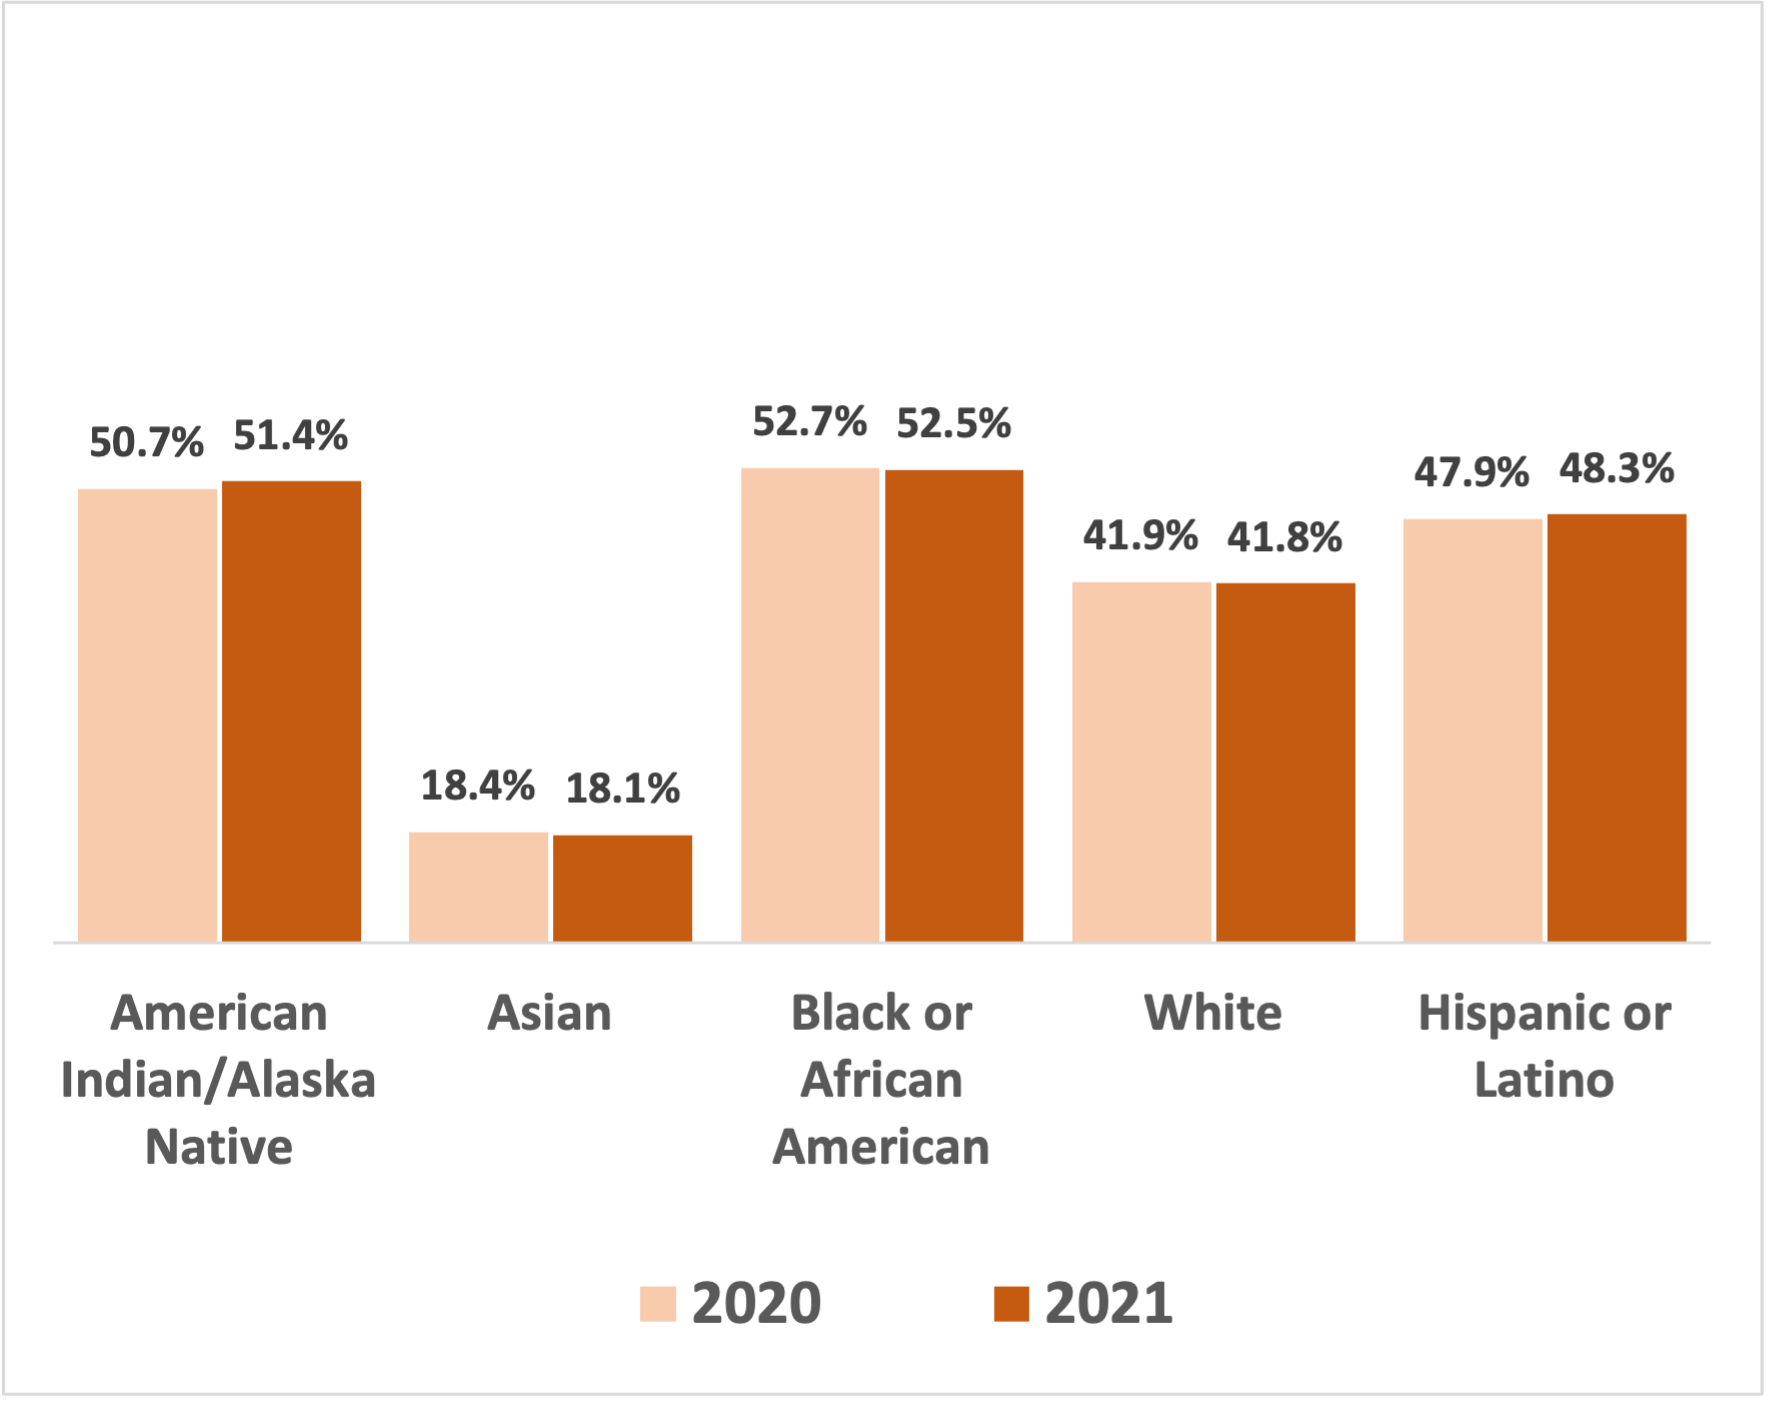
Data shown are for entire region. Race and ethnicity are distinct, not combined. Click to access detailed data by race and ethnicity for Monroe County, as well as details by age and sex for all counties.
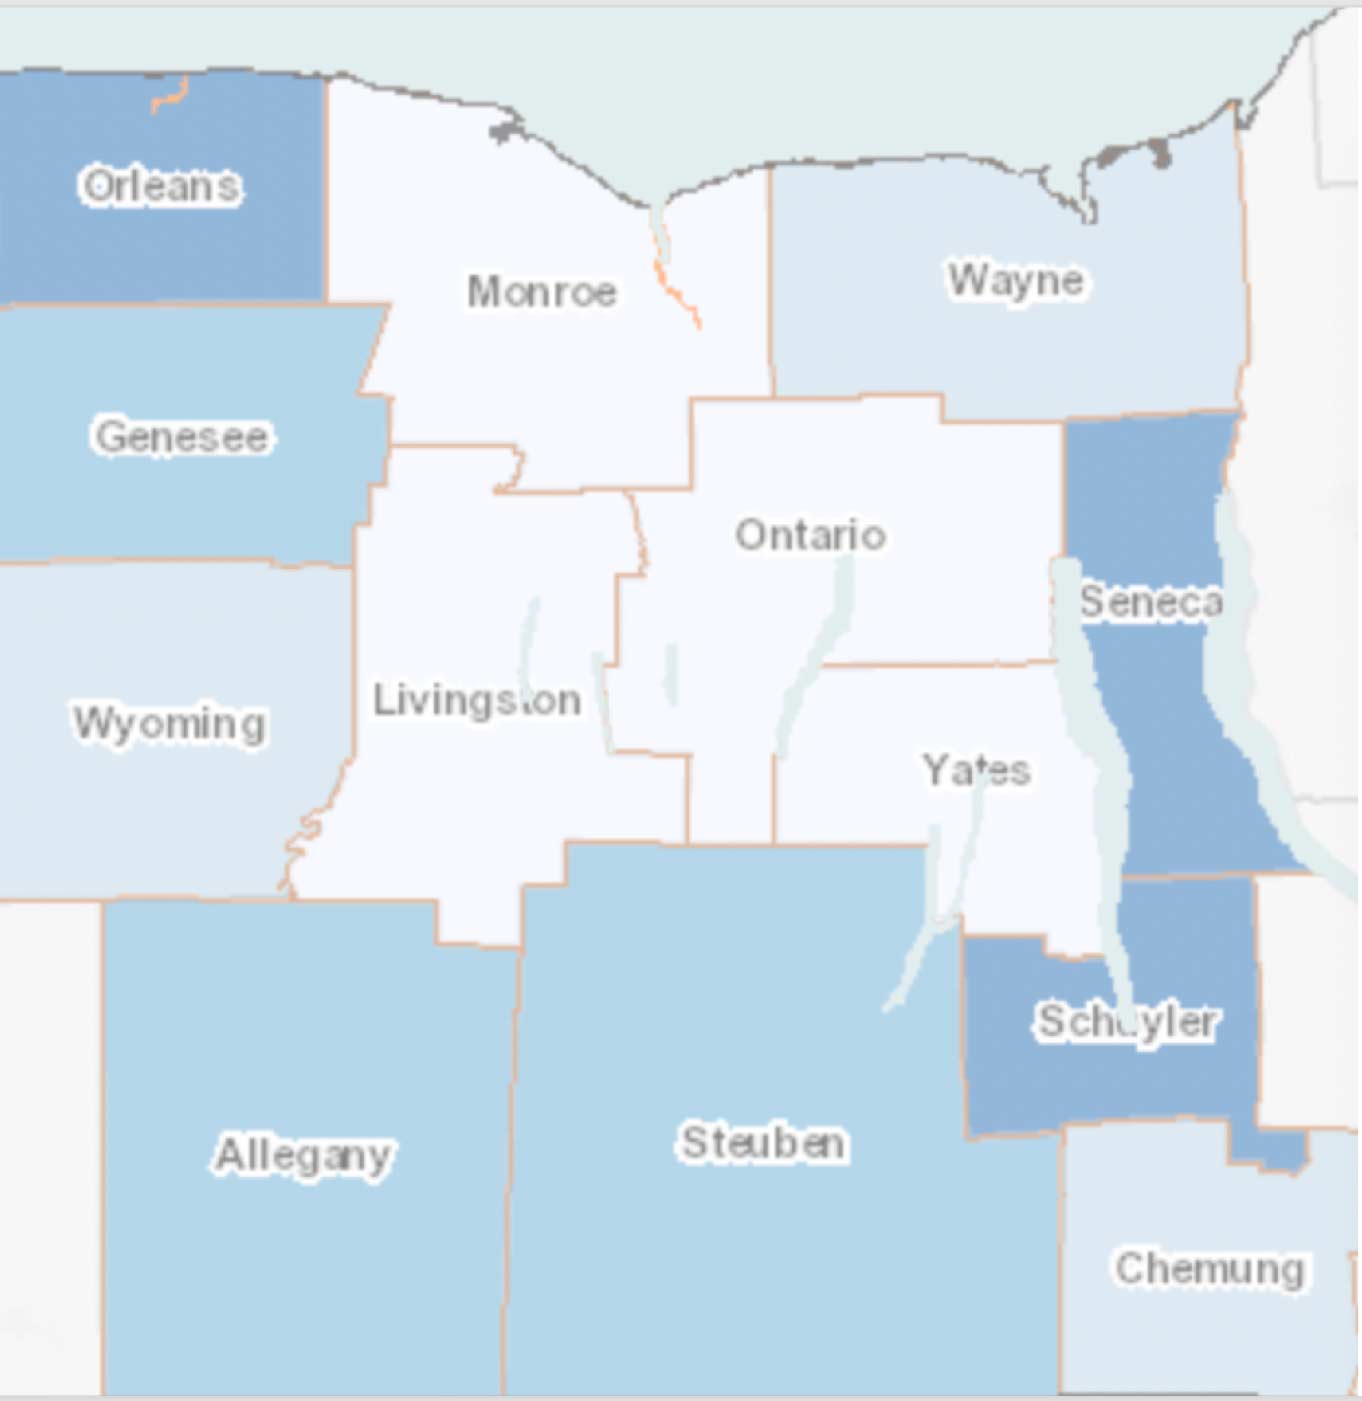
Childhood Obesity by County
Obese ( > 95th percentile), Age 5-17, % by County – RHIO 2021
22%
Of children in the region are obese
(BMI > 95th percentile)
↑ 1% change from 2020
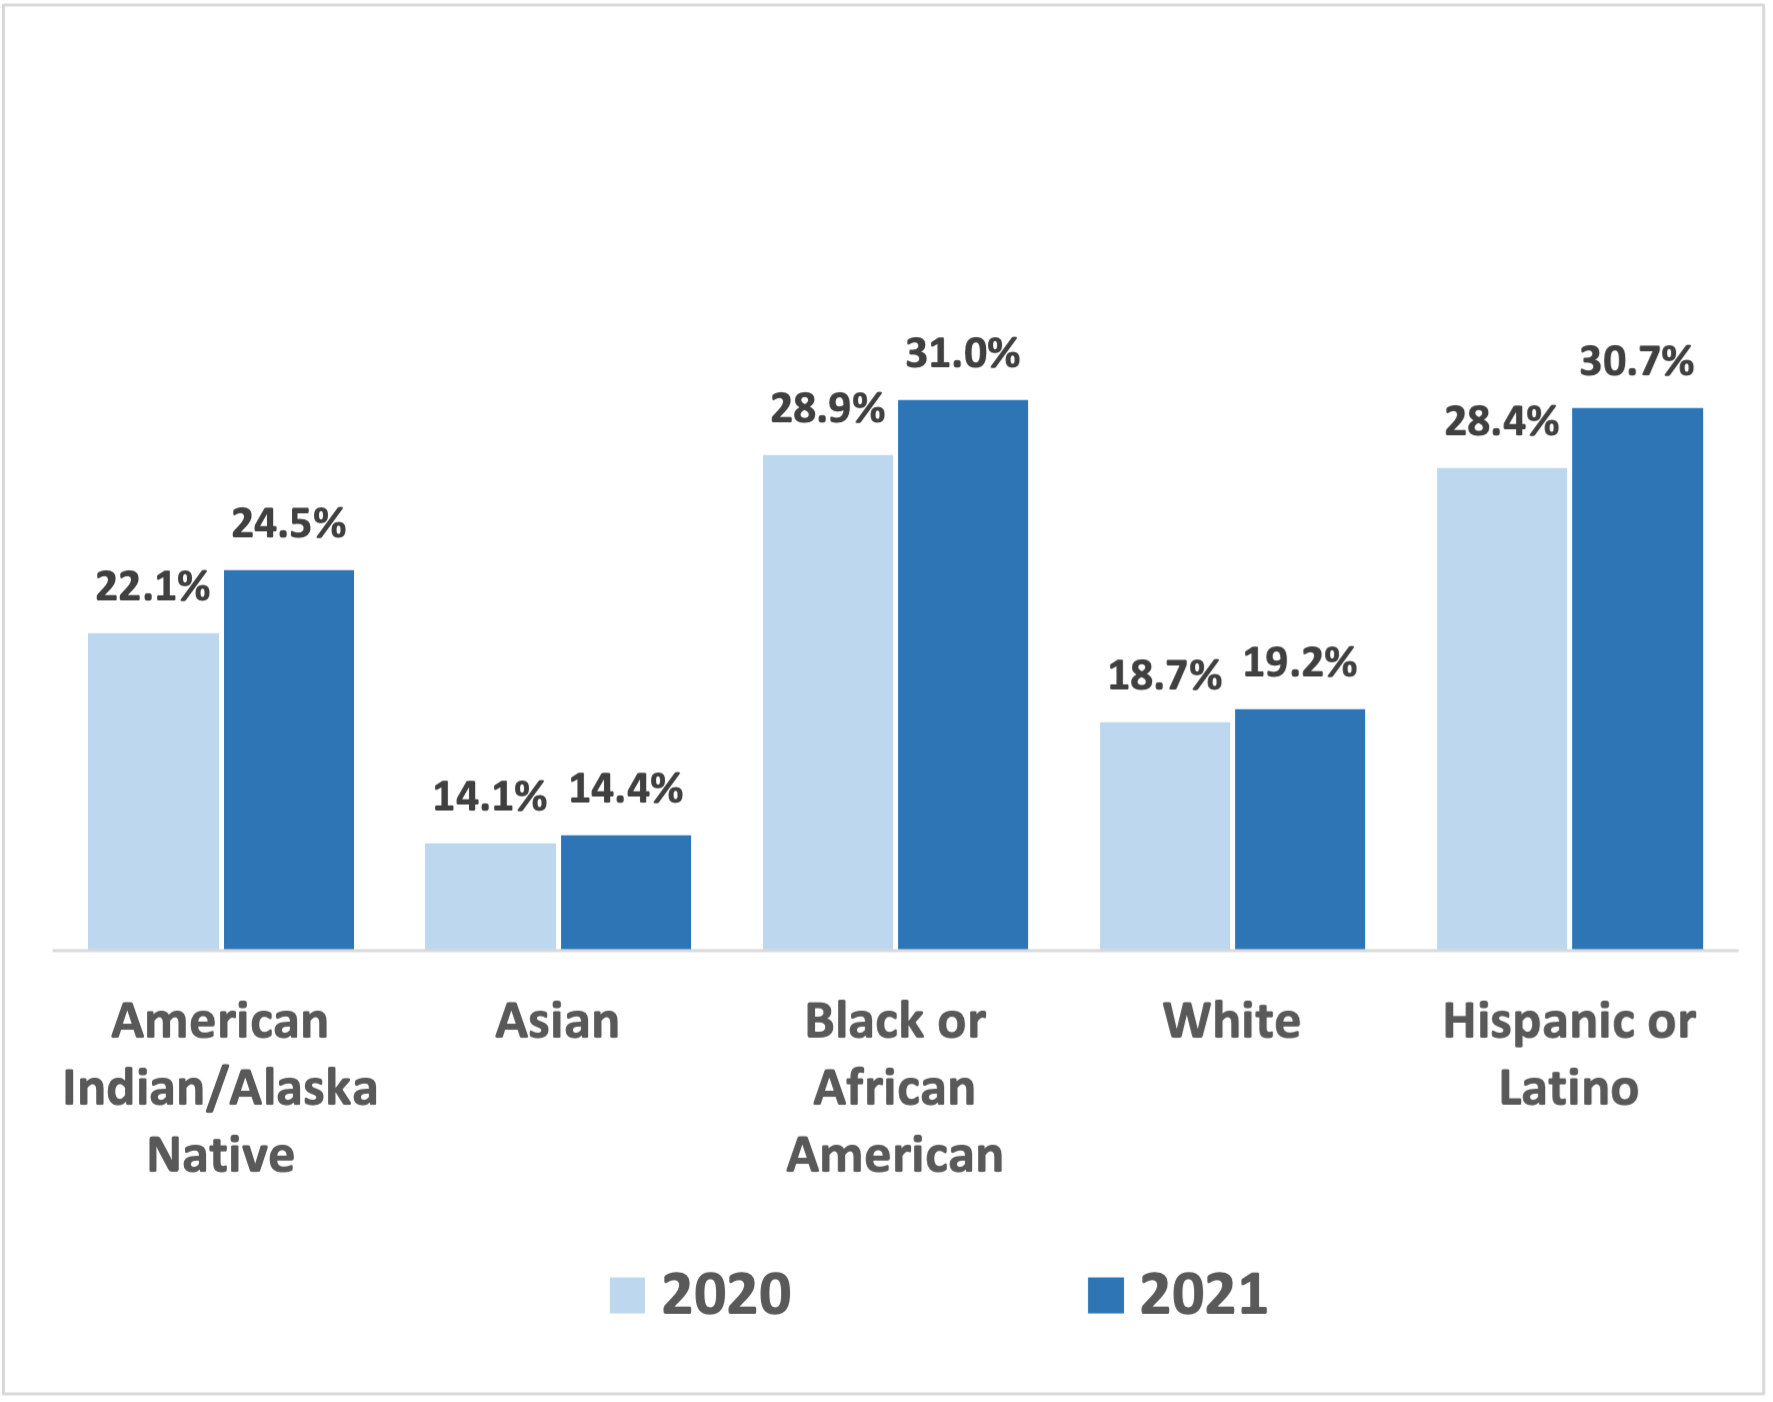
Data shown are for entire region. Race and ethnicity are distinct, not combined. Click to access detailed data by race and ethnicity for Monroe County, as well as details by age and sex for all counties.
